Introduction
CRISPRloci provides an automated and comprehensive in silico characterization of CRISPR-Cas system on bacterial and archaeal genomes. It is a full suite for CRISPR locus characteriztion that includes CRISPR array orientation, detection of conserved leaders, cas gene annotation and subtype classification.
When using CRISPRloci please cite :
- Omer S. Alkhnbashi, Alexander Mitrofanov, Robson Bonidia, Martin Raden, Van Dinh Tran, Florian Eggenhofer, Shiraz A. Shah, Ekrem ̈Öztürk, Victor A. Padilha, Danilo S. Sanches, Andre C.P.L.F. de Carvalho and Rolf Backofen
CRISPRloci: comprehensive and accurate annotation of CRISPR–Cas systems
Nucleic Acids Research, 2021. - Alexander Mitrofanov, Omer S. Alkhnbashi, Sergey A. Shmakov, Kira S. Makarova, Eugene V. Koonin, and Rolf Backofen
CRISPRidentify: identification of CRISPR arrays using machine learning approach
Nucleic Acids Research, 49(4), e20, 2021. - Victor A. Padilha, Omer S. Alkhnbashi, Van Dinh Tran, Shiraz A. Shah, Andre C.P.L. de Carvalho and Rolf Backofen
Casboundary: automated definition of integral Cas cassettes
Bioinformatics, 2021. - Victor A. Padilha, Omer S. Alkhnbashi, Shiraz A. Shah, Andre C.P.L.F. de Carvalho and Rolf Backofen
CRISPRcasIdentifier: Machine learning for accurate identification and classification of CRISPR-Cas systems
Gigascience, 9(6), 2020. - Martin Raden, Syed M Ali, Omer S Alkhnbashi, Anke Busch, Fabrizio Costa, Jason A Davis, Florian Eggenhofer, Rick Gelhausen, Jens Georg, Steffen Heyne, Michael Hiller, Kousik Kundu, Robert Kleinkauf, Steffen C Lott, Mostafa M Mohamed, Alexander Mattheis, Milad Miladi, Andreas S Richter, Sebastian Will, Joachim Wolff, Patrick R Wright, and Rolf Backofen
Freiburg RNA tools: a central online resource for RNA-focused research and teaching
Nucleic Acids Research, 46(W1), W25-W29, 2018.
Results are computed with CRISPRloci version 1.1.0
Overview
The following parameters are used to control the execution of CRISPRloci
- Input Parameters
- Genome information
- Parameters concerning CRISPR arrays
- CRISPR array orientation prediction
- ML model to use
- Detect the IS-element
- Compute degenerated repeat
- Fast run mode
- Enhancement of the predicted array
- Enhancement of the start and end of the array
- Min. repeat length in the array
- Max. repeat length in the array
- Min. spacer length in the array
- Max. spacer length in the array
- Min. number of repeats in the array
- Max. edit distance for evaluated array enhancement
- Max. number of identical spacers in the array
- Max. number of consecutive identical spacers in the array
- Max. length of the spacer's margin for the degenerated search
- Parameters concerning Cas genes
- Parameters for CRISPR repeat input
- Parameters for Virus DNA/RNA input
Furthermore, additional information is available
Input Parameters
 Sequence(s)
A sequence entry in FASTA format needs to have a description line (also called header line, starting with '>'), typically including a sequence ID and optionally a description, followed by the corresponding sequence in the subsequence new line(s).
In case of GenBank format upload, input check is only done in the backend script and might result in job abortion for badly formatted input.
The parameter constraints are: FASTA format: Depending on the input type, sequences have to be valid DNA [ACGT], RNA repeats [ACGTU], proteins [ACDEFGHIKLMNPQRSTVWY#*] or virus DNA/RNA [ACGTU]. GenBank format: will be converted to FASTA format. Note, not all GenBank format variants are supported.
Defaults to ()
Defaults to ()
 Sequence type
DNA model
The model can accept either a complete or partial of the archeal and bacterial genome in a Fasta or GenBank format as input. Note, only SINGLE genome analysis is supported, i.e. no multi-sequence upload is accepted in this model. The user can upload a DNA sequence file or paste the sequence in the submission page. Based on a set of several published tools, the CRISPRloci web server will provide a comprehensive annotation of CRISPR-Cas elements which can be divided into five major categories of information: (i) detection of CRISPR arrays; (ii) prediction CRISPR arrays orientation; (iii) determine the leader sequence; (iv) identification/detection of cassette boundary and Cas proteins; (v) Subtype classification of Cas proteins. Also, the DNA mode provides information about the prophage region by using Phaster tools and correlates this annotation with the self-targeting spacer searcher detections. Finally, it calculates the structure accuracy to measure the structural stability of the structure repeat.
When uploading genomic data in GenBank format, CDS information is extracted. To this end, each CDS entry has to feature a 'translation' tag with its amino acid sequence in concert with one of the following identifier tags (locus_tag, old_locus_tag, or protein_id).
Protein model
It accepts a set of prokaryotes proteins which can be loaded or pasted. The input can be one or multiple proteins, or a complete proteome from bacteria or archaea of your interest. It works as follows: (i) identify Cas proteins; (ii) define/detect the cassette boundaries; (iii) finally classify the Cas proteins into subtypes.
Repeat model
It accepts input in the form of one or more CRISPR consensus sequences (repeat sequence only) in FASTA format. For a CRISPR array, a single repeat sequence should be chosen that is either most common or represents the consensus of all repeat instances in the array. You can choose between directly typing in (or pasting) your FASTA formatted sequences into the text field or uploading a file containing the FASTA formatted sequences. This mode has only two functionally as following: (i) Identify the orientation and the subtype CRISPR arrays based on the sequences of the direct repeats only; (ii) The search against the local databases finds regions of local similarities between the input sequence(s) and the list of consensus repeat of Bona-Fide category.
Virus model
The model can accept either a complete or partial of the viral and phage genome in a Fasta format as input. Note, only SINGLE genome analysis is supported, i.e. no multi-sequence upload is accepted in this model. The user can upload a DNA sequence file or paste the sequence in the submission page. The virus mode mainly shows information about Host viral interaction. It reports how many spacers potential came from input viral genome.
Please see the sections of input parameters and output results for further information.
Genome information
 DNA sequence completeness
Specifies whether the DNA data consists of a complete or partial genomic sequence.
Parameters concerning CRISPR arrays
 CRISPR array orientation prediction
Specifies if the array orientation should be predicted.
 ML model to use
Specifying the classification model. If 'all' is selected, the certainty score will be calculated as average between all available models.
 Detect the IS-element
Specifies if IS-Elements should be predicted.
 Compute degenerated repeat
Allows search for degenerated repeat candidates on both ends of the CRISPR array candidate.
 Fast run mode
Specifies if the repeat set enhancement step should be skipped, which drastically speeds up the process but might decrease the recall quality. Only matching pairs found with Vmatch will be used as repeat candidates. Automatically turns off filter approximation and start_end approximation (see enhancement_max_min and enhancement_start_end) Turned off by default.
 Enhancement of the predicted array
Specifies if the filter approximation based on the max. and min. elements should be built.
 Enhancement of the start and end of the array
Specifies if the start/end omitting of the repeat candidates should be done to enrich the candidate set.
 Min. repeat length in the array
Specifies the minimum length of repeats in a CRISPR array.
The parameter constraints are: Input value has to be parsable as Integer. The value must be greater than or equal to 15 and must be smaller than or equal to 30.
Defaults to (21)
Defaults to (21)
 Max. repeat length in the array
Specifies the maximum length of repeats in a CRISPR array.
The parameter constraints are: Input value has to be parsable as Integer. The value must be greater than or equal to 15 and must be smaller than or equal to 72.
Defaults to (55)
Defaults to (55)
 Min. spacer length in the array
Specifies the minimum average length of spacers in a CRISPR array.
The parameter constraints are: Input value has to be parsable as Integer. The value must be greater than or equal to 10 and must be smaller than or equal to 30.
Defaults to (18)
Defaults to (18)
 Max. spacer length in the array
Specifies the maximum average length of spacers in a CRISPR array.
The parameter constraints are: Input value has to be parsable as Integer. The value must be greater than or equal to 10 and must be smaller than or equal to 100.
Defaults to (78)
Defaults to (78)
 Min. number of repeats in the array
Specifies the minimum number of repeats in a CRISPR array.
The parameter constraints are: Input value has to be parsable as Integer. The value must be greater than or equal to 2 and must be smaller than or equal to 10000.
Defaults to (3)
Defaults to (3)
 Max. edit distance for evaluated array enhancement
Specifies the number of editing operations for candidate enhancement.
The parameter constraints are: Input value has to be parsable as Integer. The value must be greater than or equal to 4 and must be smaller than or equal to 10.
Defaults to (6)
Defaults to (6)
 Max. number of identical spacers in the array
Specifies the maximum allowed number of identical spacers in the array. If the number of identical spacers in the candidate exceeds the threshold the candidate is being discarded.
The parameter constraints are: Input value has to be parsable as Integer. The value must be greater than or equal to 2 and must be smaller than or equal to 20.
Defaults to (4)
Defaults to (4)
 Max. number of consecutive identical spacers in the array
Specifies the maximum allowed number of identical consecutive spacers in the array. If the number of identical consecutive spacers in the candidate exceeds the threshold the candidate is being discarded.
The parameter constraints are: Input value has to be parsable as Integer. The value must be greater than or equal to 2 and must be smaller than or equal to 20.
Defaults to (3)
Defaults to (3)
 Max. length of the spacer's margin for the degenerated search
Specifies the maximum length difference between a new spacer sequence (obtained with the search of degenerated repeats) and the average value of spacer length in the array.
The parameter constraints are: Input value has to be parsable as Integer. The value must be greater than or equal to 20 and must be smaller than or equal to 50.
Defaults to (30)
Defaults to (30)
Parameters concerning Cas genes
 ML model to run
Run mode. It may be either classification or combined. For the former, only classification models are applied to the identified CRISPR cassettes. For the latter, CRISPRcasIdentifier first tries to predict the normalized bitscores of potentially missing Cas proteins and then proceeds to the subtype classification step. Available options: classification, regression or combined (default: combined).
 Select the classifiers
Which classifier(s) will be used to assign the subtype of the identified CRISPR cassettes. The available options are CART, SVM or ERT (default: ERT).
 Select the regressors
Which regressor(s) will be used to estimate the normalized bitscores of potentially missing proteins in the identified CRISPR cassettes. The available options are CART, SVM or ERT (default: ERT).
 Max. number of contiguous gaps in a cassette
A CRISPR cassette may contain non-cas or unannotated cas genes, which are considered as gaps inside the cassette. This parameter specifies the maximum number of contiguous gene gaps that are allowed when defining the boundaries of a cassette. This value must be contained in 0-3 (default: 2).
The parameter constraints are: Input value has to be parsable as Integer. The value must be greater than or equal to 0 and must be smaller than or equal to 3.
Defaults to (2)
Defaults to (2)
Parameters for CRISPR repeat input
 Hit sensitivity (e-value threshold)
The significance E-value thresholds will set matches with E-values less than or equal to the cut-off e-value as being significant.
The parameter constraints are: Input value has to be parsable as Double. The value must be greater than or equal to 0 and must be smaller than or equal to 1.
Defaults to (0.01)
Defaults to (0.01)
Parameters for Virus DNA/RNA input
 Hit sensitivity (e-value threshold)
The significance E-value threshold will set matches with E-values less than or equal to the cut-off as being significant.
The parameter constraints are: Input value has to be parsable as Double. The value must be greater than or equal to 0 and must be smaller than or equal to 1.
Defaults to (0.000001)
Defaults to (0.000001)
Output Description
The output of CRISPRloci eventually depends on the provided input, i.e. sequence type.
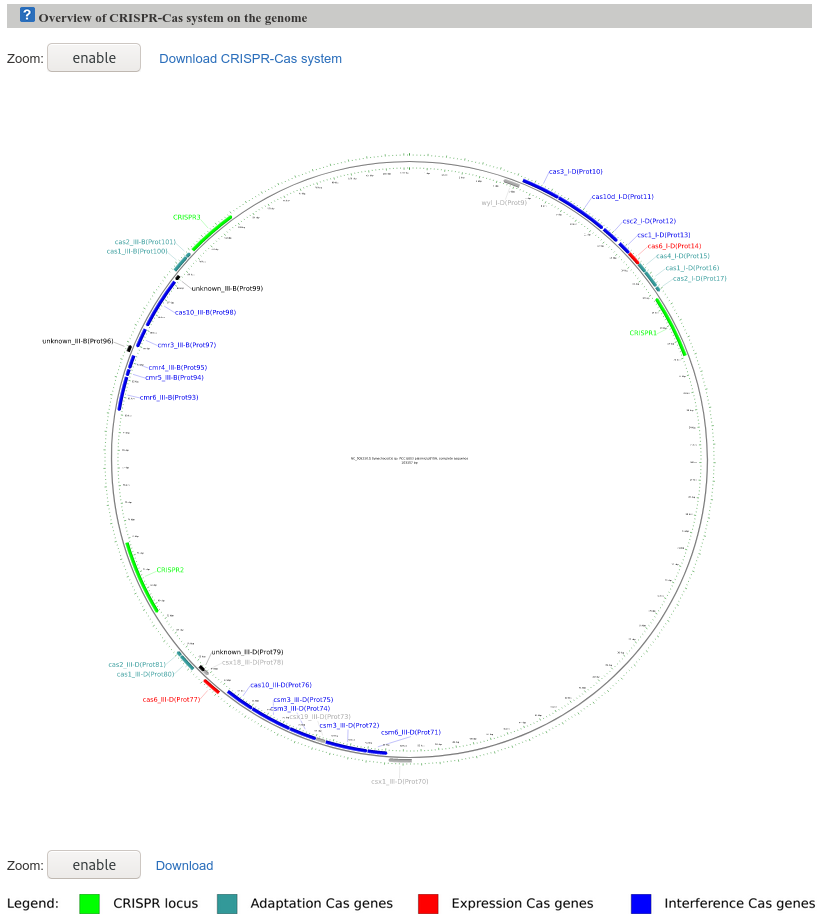
The Map-figure shows an overview of the CRISPR-Cas systems in the genome. In general, it provides a global overview of CRISPR-Cas systems present in the genome and visualizes the results in an interactive genome map and includes the ability to zoom in and click for additional information.

Table of CRISPR-Cas locus in the genome. Ordered list of CRISPR loci providing individual information, including strand and subtype.
The list is clickable (Bona-Fide, Alternative, Possible, Possible_Discarded, and Low Score, etc), revealing additional information about the locus of interest, including leader sequence, downstream region, consensus repeat sequence, IS-element, array features, certainty score and the option of forwarding the consensus repeat to the CRISPRmap server (last column). This is useful if a user wants to know which other organisms harbor similar CRISPR loci based on the motif structure or sequence family.
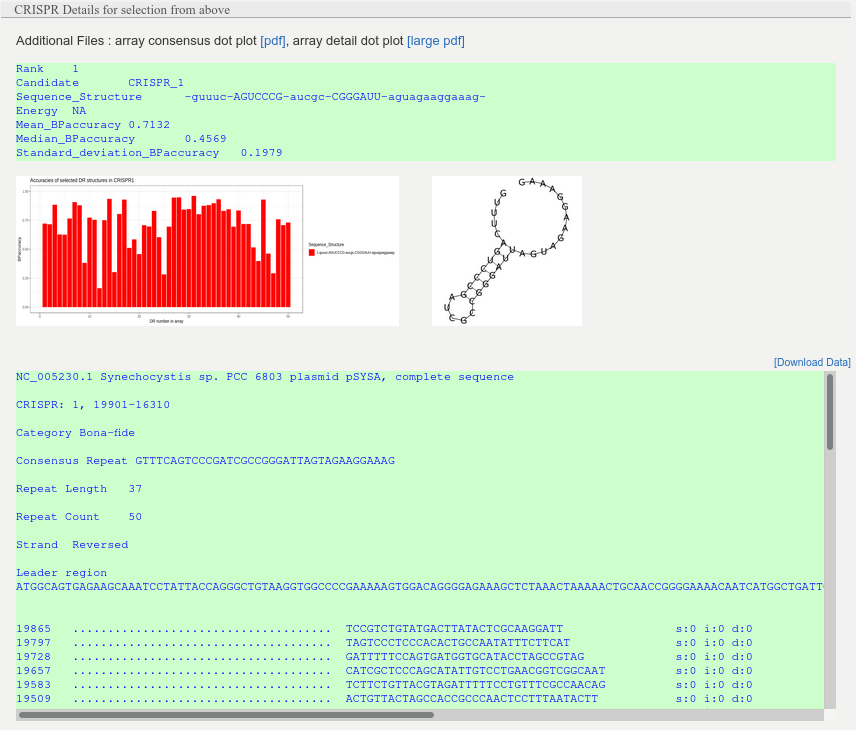
This interactive table describes CRISPR arrays. Included are the location and average length of each repeat and spacer as well as the consensus repeat sequence, array category and subtype. Users can access additional information by clicking on the corresponding row. For each array the MFE structure of the consensus repeat sequence will appear as well as the structure accuracy distribution for each of the repeat sequences in the array. In addition to that the user can see the text representation of the CRISPR array complemented with Leader and downstream regions as well as the corresponding feature values and corresponding certainty score for the array.
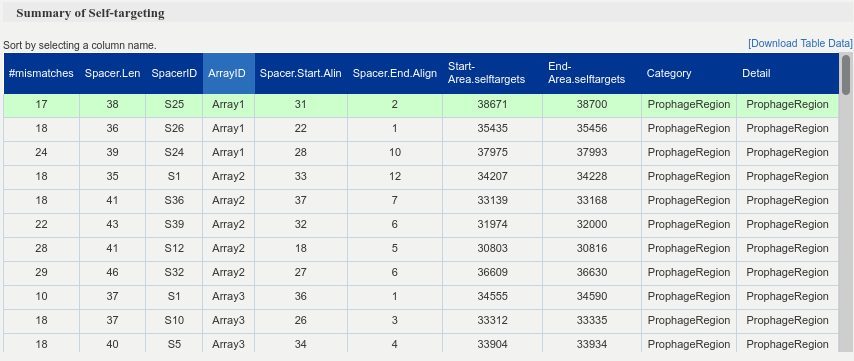
Table of self-targeting spacer searcher detections. In this table we use all spacer sequences originating from all detected arrays in the input genome. The concept of self targeting is to look for matches of the spacers in different regions of the genome and report the number, location, coverage and mismatches. We characterize the location into three different groups (prophage area, genomic area and Cas genes area). The prophage areas were annotated using phaster program and the Cas gene areas were annotated via CRISPRCasIdentifier program. It lists region intervals of potential self-targeting alongside with each region’s category and label. Furthermore, the corresponding origin spacer is shown with the number of mismatches between sequences.
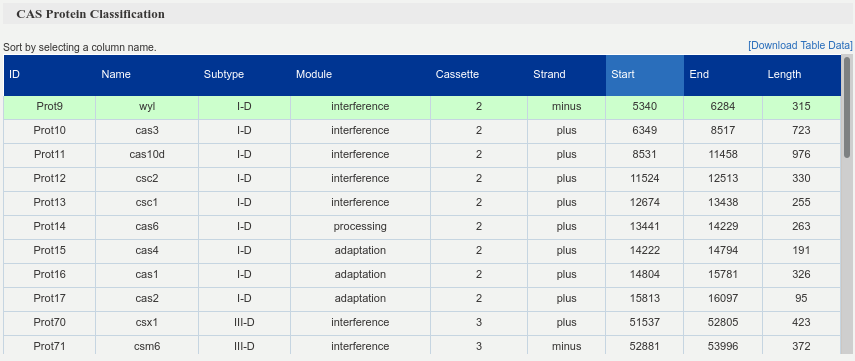
Summary table of the CRISPR cassettes, which are identified by different cassette ids (“Cassette” column). It presents all detected Cas proteins, each one described by its name, cassette id and subtype, module, strand, start and end coordinates and length. By clicking on each row, the corresponding Cas protein sequence is shown below the table.

Box showing the sequence of the selected CAS protein.

Summary table of predicted CRISPR repeats. The columns contain the repeat ids, input and predicted sequences, strand, confidence and subtype.
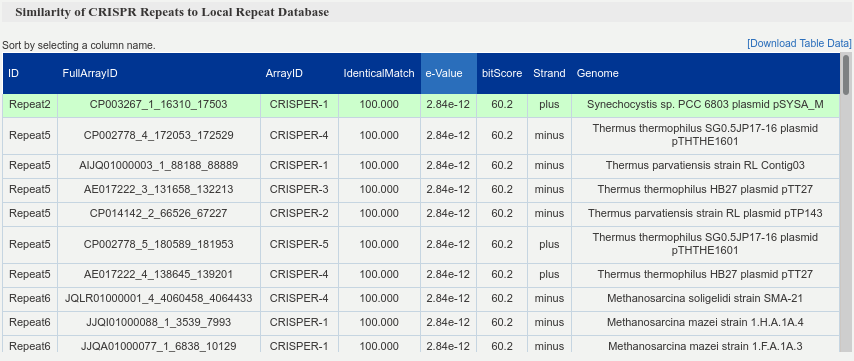
Table of Similarity of CRISPR Repeats to Local Repeat Database. It shows the repeat sequences found in the genome as well as their similarity with the sequences obtained from the local database For each hit, full ID, accession number and hit region are provided, as well as the hit identity, e-value, bit-score and orientation.

The box provides details for the selected CRIPSR repeat and the associated database hit (Accession number, array id, start, end, aligned subsequence, alignment consensus).
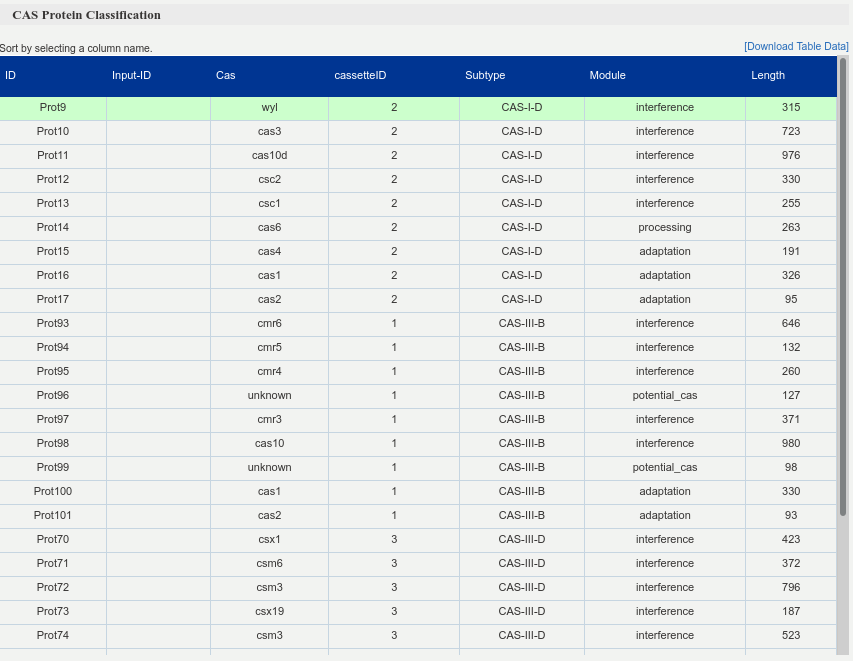
Summary table of the identified CRISPR cassettes, which are identified by different ids (cassetteID - column). Each row describes several features of a different Cas protein (id, Cas label, subtype, module and length) and, by clicking on it, the corresponding protein sequence is shown below the table.

Box showing the sequence of the selected CAS protein.
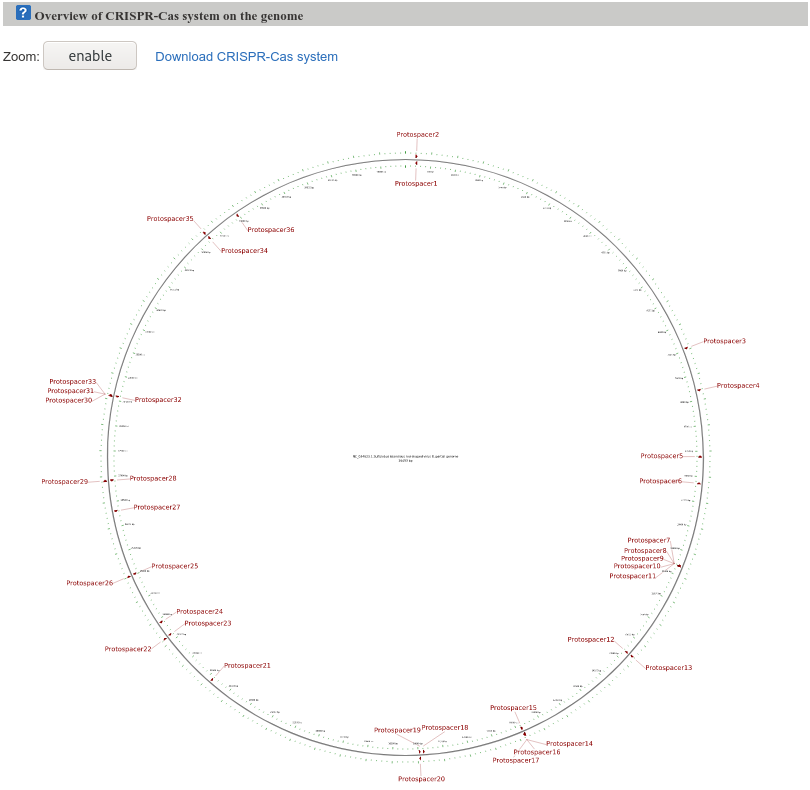
The circular map figure shows an overview of the protospacer in the viral genome. It allows the user to visualize the results, and it can be zoomed in and clicked for additional information. The protospacers are shown in the corresponding location with indication of their orientation.
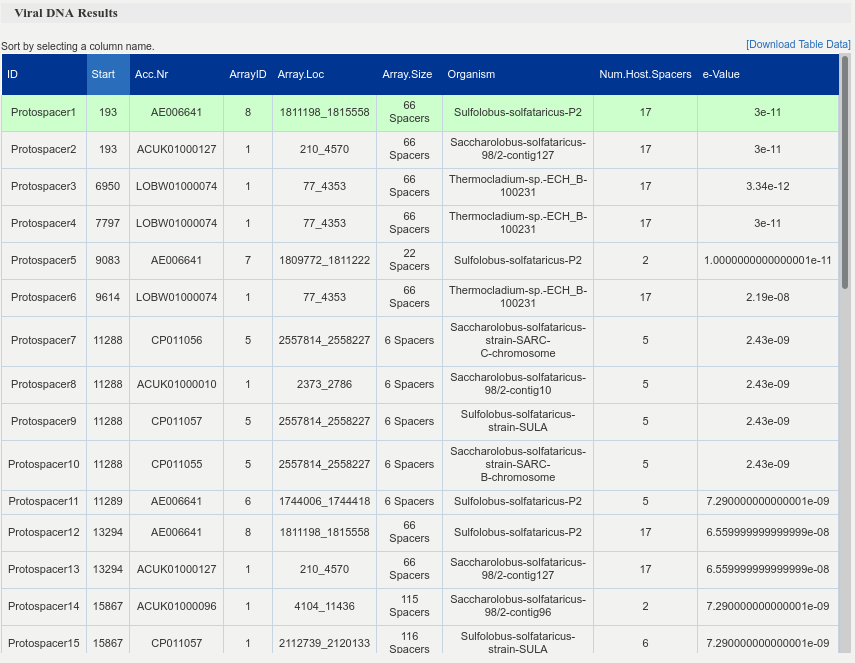
Summary table that maps the protospacers to spacers in the found CRISPR-arrays. For each protospacer it provides the host accession number, the array coordinates and its size. This information is complemented with the e-value for the hit and the total number of spacers which the host acquired from the suspected viral genome.

Box providing detailed information about the selected viral DNA entry (Target accession, sequence, Start, Strand, Spacer id, query sequence, hit sequence, alignment start, alignment end, alignment strand)
DNA mode

The Map-figure shows an overview of the CRISPR-Cas systems in the genome. In general, it provides a global overview of CRISPR-Cas systems present in the genome and visualizes the results in an interactive genome map and includes the ability to zoom in and click for additional information.

Table of CRISPR-Cas locus in the genome. Ordered list of CRISPR loci providing individual information, including strand and subtype.
The list is clickable (Bona-Fide, Alternative, Possible, Possible_Discarded, and Low Score, etc), revealing additional information about the locus of interest, including leader sequence, downstream region, consensus repeat sequence, IS-element, array features, certainty score and the option of forwarding the consensus repeat to the CRISPRmap server (last column). This is useful if a user wants to know which other organisms harbor similar CRISPR loci based on the motif structure or sequence family.

This interactive table describes CRISPR arrays. Included are the location and average length of each repeat and spacer as well as the consensus repeat sequence, array category and subtype. Users can access additional information by clicking on the corresponding row. For each array the MFE structure of the consensus repeat sequence will appear as well as the structure accuracy distribution for each of the repeat sequences in the array. In addition to that the user can see the text representation of the CRISPR array complemented with Leader and downstream regions as well as the corresponding feature values and corresponding certainty score for the array.

Table of self-targeting spacer searcher detections. In this table we use all spacer sequences originating from all detected arrays in the input genome. The concept of self targeting is to look for matches of the spacers in different regions of the genome and report the number, location, coverage and mismatches. We characterize the location into three different groups (prophage area, genomic area and Cas genes area). The prophage areas were annotated using phaster program and the Cas gene areas were annotated via CRISPRCasIdentifier program. It lists region intervals of potential self-targeting alongside with each region’s category and label. Furthermore, the corresponding origin spacer is shown with the number of mismatches between sequences.

Summary table of the CRISPR cassettes, which are identified by different cassette ids (“Cassette” column). It presents all detected Cas proteins, each one described by its name, cassette id and subtype, module, strand, start and end coordinates and length. By clicking on each row, the corresponding Cas protein sequence is shown below the table.

Box showing the sequence of the selected CAS protein.
Repeat mode

Summary table of predicted CRISPR repeats. The columns contain the repeat ids, input and predicted sequences, strand, confidence and subtype.

Table of Similarity of CRISPR Repeats to Local Repeat Database. It shows the repeat sequences found in the genome as well as their similarity with the sequences obtained from the local database For each hit, full ID, accession number and hit region are provided, as well as the hit identity, e-value, bit-score and orientation.

The box provides details for the selected CRIPSR repeat and the associated database hit (Accession number, array id, start, end, aligned subsequence, alignment consensus).
Protein mode

Summary table of the identified CRISPR cassettes, which are identified by different ids (cassetteID - column). Each row describes several features of a different Cas protein (id, Cas label, subtype, module and length) and, by clicking on it, the corresponding protein sequence is shown below the table.

Box showing the sequence of the selected CAS protein.
Virus DNA/RNA mode

The circular map figure shows an overview of the protospacer in the viral genome. It allows the user to visualize the results, and it can be zoomed in and clicked for additional information. The protospacers are shown in the corresponding location with indication of their orientation.

Summary table that maps the protospacers to spacers in the found CRISPR-arrays. For each protospacer it provides the host accession number, the array coordinates and its size. This information is complemented with the e-value for the hit and the total number of spacers which the host acquired from the suspected viral genome.

Box providing detailed information about the selected viral DNA entry (Target accession, sequence, Start, Strand, Spacer id, query sequence, hit sequence, alignment start, alignment end, alignment strand)
Input Examples
 Repeat mode
Repeat mode
The example's result can be directly accessed here
 Viral DNA mode
Genomic region of of Sulfolobus islandicus rod-shaped virus 8 (NC_034623)
The example's result can be directly accessed here
 DNA mode
Synechocystis sp. PCC 6803 plasmid pSYSA (NC_005230)
The example's result can be directly accessed here
 Protein mode
Protein mode
The example's result can be directly accessed here
List of Changes
- 4.9.0 - 210531 : V1.1.0 goes online


