
Introduction
When using CARNA please cite :
- Dragos A. Sorescu, Mathias Moehl, Martin Mann, Rolf Backofen, and Sebastian Will
CARNA - alignment of RNA structure ensembles
Nucleic Acids Reseach, 2012, 40 no. W1 pp. W49-W53 - Alessandro Dal Palu, Mathias Moehl, Sebastian Will
A Propagator for Maximum Weight String Alignment with Arbitrary Pairwise Dependencies
Proceedings of the 16th International Conference on Principles and Practice of Constraint Programming (CP-2010), 2010, 8 - Martin Raden, Syed M Ali, Omer S Alkhnbashi, Anke Busch, Fabrizio Costa, Jason A Davis, Florian Eggenhofer, Rick Gelhausen, Jens Georg, Steffen Heyne, Michael Hiller, Kousik Kundu, Robert Kleinkauf, Steffen C Lott, Mostafa M Mohamed, Alexander Mattheis, Milad Miladi, Andreas S Richter, Sebastian Will, Joachim Wolff, Patrick R Wright, and Rolf Backofen
Freiburg RNA tools: a central online resource for RNA-focused research and teaching
Nucleic Acids Research, 46(W1), W25-W29, 2018.
Overview
The following parameters are used to control the execution of CARNA
Furthermore, additional information is available
Input Parameter
 Sequence Input in FASTA Format
>fruA
CCUCGAGGGGAACCCGAAAGGGACCCGAGAGG
>fdhA
CGCCACCCUGCAACCCAAUAUAAAAUAAUACAAGGGAGCAGGUGGCG
>vhuU
AGCUCACAACCGAACCCAUUUGGGAGGUUGUGAGCU
>hdrA
GGCACCACUCGAAGGCUAAGCCAAAGUGGUGCU
Input can be given either as direct text input or by uploading a file.
Since CARNA is tailored for sequence-structure alignment, additional structure information can be provided by the user. To this end, an extended FASTA format is used as presented in the following. Most important, all additional lines within the FASTA file have to be tagged accordingly with a tailing '#TAG' information in order to enable the correct parsing of the user input. In the following, possible information adds and the appropriate encoding is presented.
Structure and Anchor Constraints
Along with the input sequences, one can specify constraints on the alignment, including structure constraints as well as anchor constraints. Constraints are specified in the input in the following example.>fruA CCUCGAGGGGAACCCGAAAGGGACCCGAGAGG .......(((..(((xxxx))).)))...... #S .........AAAAAA.BBBCCCC......... #1 .........123456.1231234......... #2 >fdhA CGCCACCCUGCGAACCCAAUAUAAAAUAAUACAAGGGAGCAGGUGGCG ..............(((.....xxxxxx......)))........... #S ...........AAAAAA.....BBB.........CCCC.......... #1 ...........123456.....123.........1234.......... #2Note that the line endings (#S,#1,#2,...) are part of the input and mark extensions of the standard FASTA format.
The structure constraints (lines ending in '#S') inherit their semantics from the tool RNAfold from the Vienna RNA package:
- . : no constraint for this base
- | : the corresponding base has to be paired
- x : the base is unpaired
- < base i is paired with a base j>i
- > base i is paired with a base j
- () and matching brackets ( ) (base i pairs base j)
These well-bracketed strings of the same length as the corresponding sequence, restrict the set of structures in the ensemble.
For example, the line
.......(((..(((xxxx))).)))...... #S
specifies that all structures in the ensemble allow base pairs between the positions of
corresponding opening and closing brackets and that positions "x" are
unpaired. The following symbols are available:
. - no constraint for this base
x - the base is unpaired
< - base i is paired with a base j>i
> - base i is paired with a base j<i
()- matching brackets; base i pairs base j
The anchor constraints (#1/#2 lines) are specified by giving unique names to certain sequence positions, here A1,A2,A3,A4,A5,A6,B1,B2,B3,C1,C2,C3,C4 (lines #1,#2). Positions of the same name in different sequences are aligned. The encoding of the positions is split into two lines ('#1' and '#2') where line '#1' gives the letter encoding for each subsequence (here A,B,C) while line '#2' assigns the according identifier numbers to each position [limited to 0-9]. In each sequence, names have to be unique.
Fixed Structures
Instead of structure constraints (lines ending in '#S') you can also specify fixed structures using lines ending in '#FS' as follows:>fruA CCUCGAGGGGAACCCGAAAGGGACCCGAGAGG ((((..(((...(((....))).)))..)))) #FS >fdhA CGCCACCCUGCGAACCCAAUAUAAAAUAAUACAAGGGAGCAGGUGGCG (((((((.(((...(((.................))).)))))))))) #FSWhereas structure constraints (#S) only specify parts of the structure and are used to create dot plots representing the ensemble of all structures being compatible with the constraints, fixed structures (#FS) force the ensemble considered for this sequence to contain only this one, fixed structure by generating an dot plot that contains probability one for each specified base pair and zero for all others.
The #FS string can contain pseudoknots; for this purpose, CARNA supports various bracket symbols: (),[],{},Aa,Bb,Cc,Dd. Sequences without any given structure, sequences with structure constraints (#S) and sequences with fixed structures (#FS) can be mixed freely.
Defaults to ()
Upload dot plots
Predict dot plots
The server supports two algorithms to predict dot plots automatically from the sequence. Both use a complex thermodynamic energy model for RNA. In the first variant, the server predicts dot plots without pseudoknots by RNAfold. This is the server's default, since calculating pseudoknot-free dot plots is fast and sufficient in many cases. However, using pseudoknot-free dot plots, CARNA will not be able to predict pseudoknots or improve their alignment over, e.g., LocARNA. If this is needed, one can provide pseudoknotted fixed structures, custom dot plots, or let the server predict dot plots with pseudoknots. For the latter, dot plots are generated by the tool /pairs/ of NUPACK. This program predicts dot plots using an algorithm of Dirks and Pierce that pseudoknots of specifically limited complexity. Please note that, whereas CARNA can align arbitrarily complex pseudoknots that are specified in the input dot plots, predicting dot plots with arbitrarily complex pseudoknots is computationally infeasible. Due to a limitation of NUPACK, the prediction of dot plots with pseudoknots under structure constraints is not supported.
Custom dot plots
Custom dot plots are specified in the Vienna RNA dot plot format as it is generated by RNAfold (post script, .ps, please see RNAfold man page). To specify the dot plot of a particular sequence in the FASTA input, the sequence in the uploaded file has to exactly match that sequence in the FASTA input; file names and the order of uploads are not relevant there. It is possible to upload dot plots for only some of the sequences; then, CARNA will still compute dot plots for the remaining sequences.
Scoring Parameters
Structure Weight
Defaults to (200)
Indel Opening Score
Defaults to (-500)
Indel Score
Defaults to (-350)
Use RIBOSUM
Defaults to (true)
Match Score
Defaults to (50)
Mismatch Score
Defaults to (0)
Heuristics for speed/accuracy tradeoff
Minimal Pair Probability
Defaults to (0.01)
Maximal Difference for Sizes of Matched Arcs
Defaults to (30)
Maximal Difference for Alignment Edges
Defaults to (60)
Other Parameter
Ignore Constraints
Defaults to (false)
Search Time Limit (in milliseconds)
Defaults to (300000)
Disallow Lonely Pairs
Defaults to (true)
Output Description
Conservation Dot Plots
We show conservation dot plots annotated with an arc representation of the most probable base pairs of the consensus dot plot on the right. Radio buttons on the bottom of the figures allow to switch between different dot plots and settings. For the arc representation we allow different threshold on the probability of shown base pairs.The consensus conservation dot plot (radio button "Consensus(average)") averages the input dot plots according to the alignment. The sequence shown in the consensus dot plot is a simple majority consensus sequence. This dot plot shows two copies of the averaged dot plot, one in the upper right triangle and one in the lower left triangle. The plot of the lower left triangle is annotated with the color-encoded conservation information of each base pair, resulting in a conservation consensus dot plot. More precisely, the conservation of a consensus base pair is measured as “inverse deviation” 1−2sd, where sd is the standard deviation of the base pair’s probability across all sequences in the alignment. In this way, an inverse deviation of one corresponds to perfect conservation, whereas zero corresponds to maximum variance. The color encoding is shown in the legend below.
The other radio buttons show conservation dot plots for each single RNA. For these dot plots, we project the input dot plots to the alignment and complement them with consensus and conservation information in the lower left triangle. Whereas the upper right triangle shows the probabilities of base pairs in the single sequence, the lower left triangle shows the corresponding averaged probabilities. In the upper right triangle, the user can optionally highlight all base pairs that are highly probable in the consensus setting a threshold probability (radio buttons "highlight average probabilities >=" at the bottom of the plot).
Color Legend
The lower left triangle of the dot plots contains the average dot plot colored with variance information. Pure green means maximum variance (e.g. in half of the sequences the dot has probability 0 and in the other half it has probability 1); pure red means no variance at all (the dot has the same probability in all sequences).

Alignment annotated with pseudoknot-free consensus structure
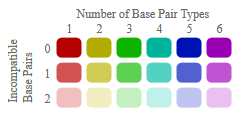
The alignment is annotated with its (pseudoknot-free) consensus structure. This "secondary structure of the alignment" is predicted by the tool RNAalifold. Due to the use of RNAalifold, this structure does not contain pseudoknots even when pseudoknots are specified and are correctly aligned by CARNA. Pseudoknots are best visualized in the provided dot plot representations. The consensus structure is printed as a string of dots and brackets on top of the alignment. The string is well-bracketed, such that base pairs in the structure are indicated by corresponding opening and closing parentheses. Furthermore, compatible base pairs are colored. The hue encodes the number of different types C-G, G-C, A-U, U-A, G-U or U-G of compatible base pairs in the corresponding columns. In this way, the hue indicates confirmation of the structure by compensatory mutations. The saturation decreases with the number of incompatible base pairs. Thus, it indicates the structural conservation of the base pair.The representation was generated by the tool RNAalifold from the Vienna RNA package.
Color Legend
Input Examples
multiple conserved structures
In this small example, we align the RNA xbix to three designed variants that fold into the same two conserved structures. xbix was introduced as an example for multiple metastable structures by Wolfinger et al. (/J.Phys.A: Math.Gen./, 2004). It is instructive to compare the alignments of these sequences by CARNA and LocARNA. Whereas CARNA's alignment preserves both conserved structures in the consensus ensemble, LocARNA aligns only one of the two structures correctly and misaligns the other. The example works with the default settings of the server, i.e. dot plots of the ensembles are predicted without pseudoknots by RNAfold. For further illustration, we list the sequences with their conserved structures. xbixA is the original example from Wolfinger et al.
>xbixA
CUGCGGCUUUGGCUCUAGCC
....((((........))))
(((.(((....))).)))..
>xbixB
CAUACCCAAUACGGGAUGGG
....((((........))))
(((.(((.....))))))..
>xbixC
GUGCGCGUUAUUCGUCUACGC
....((((.........))))
(((.(((.....))).)))..
>xbixD
GGGCCGGGUUGUUGCUCCCG
....((((........))))
(((.(((....))).)))..
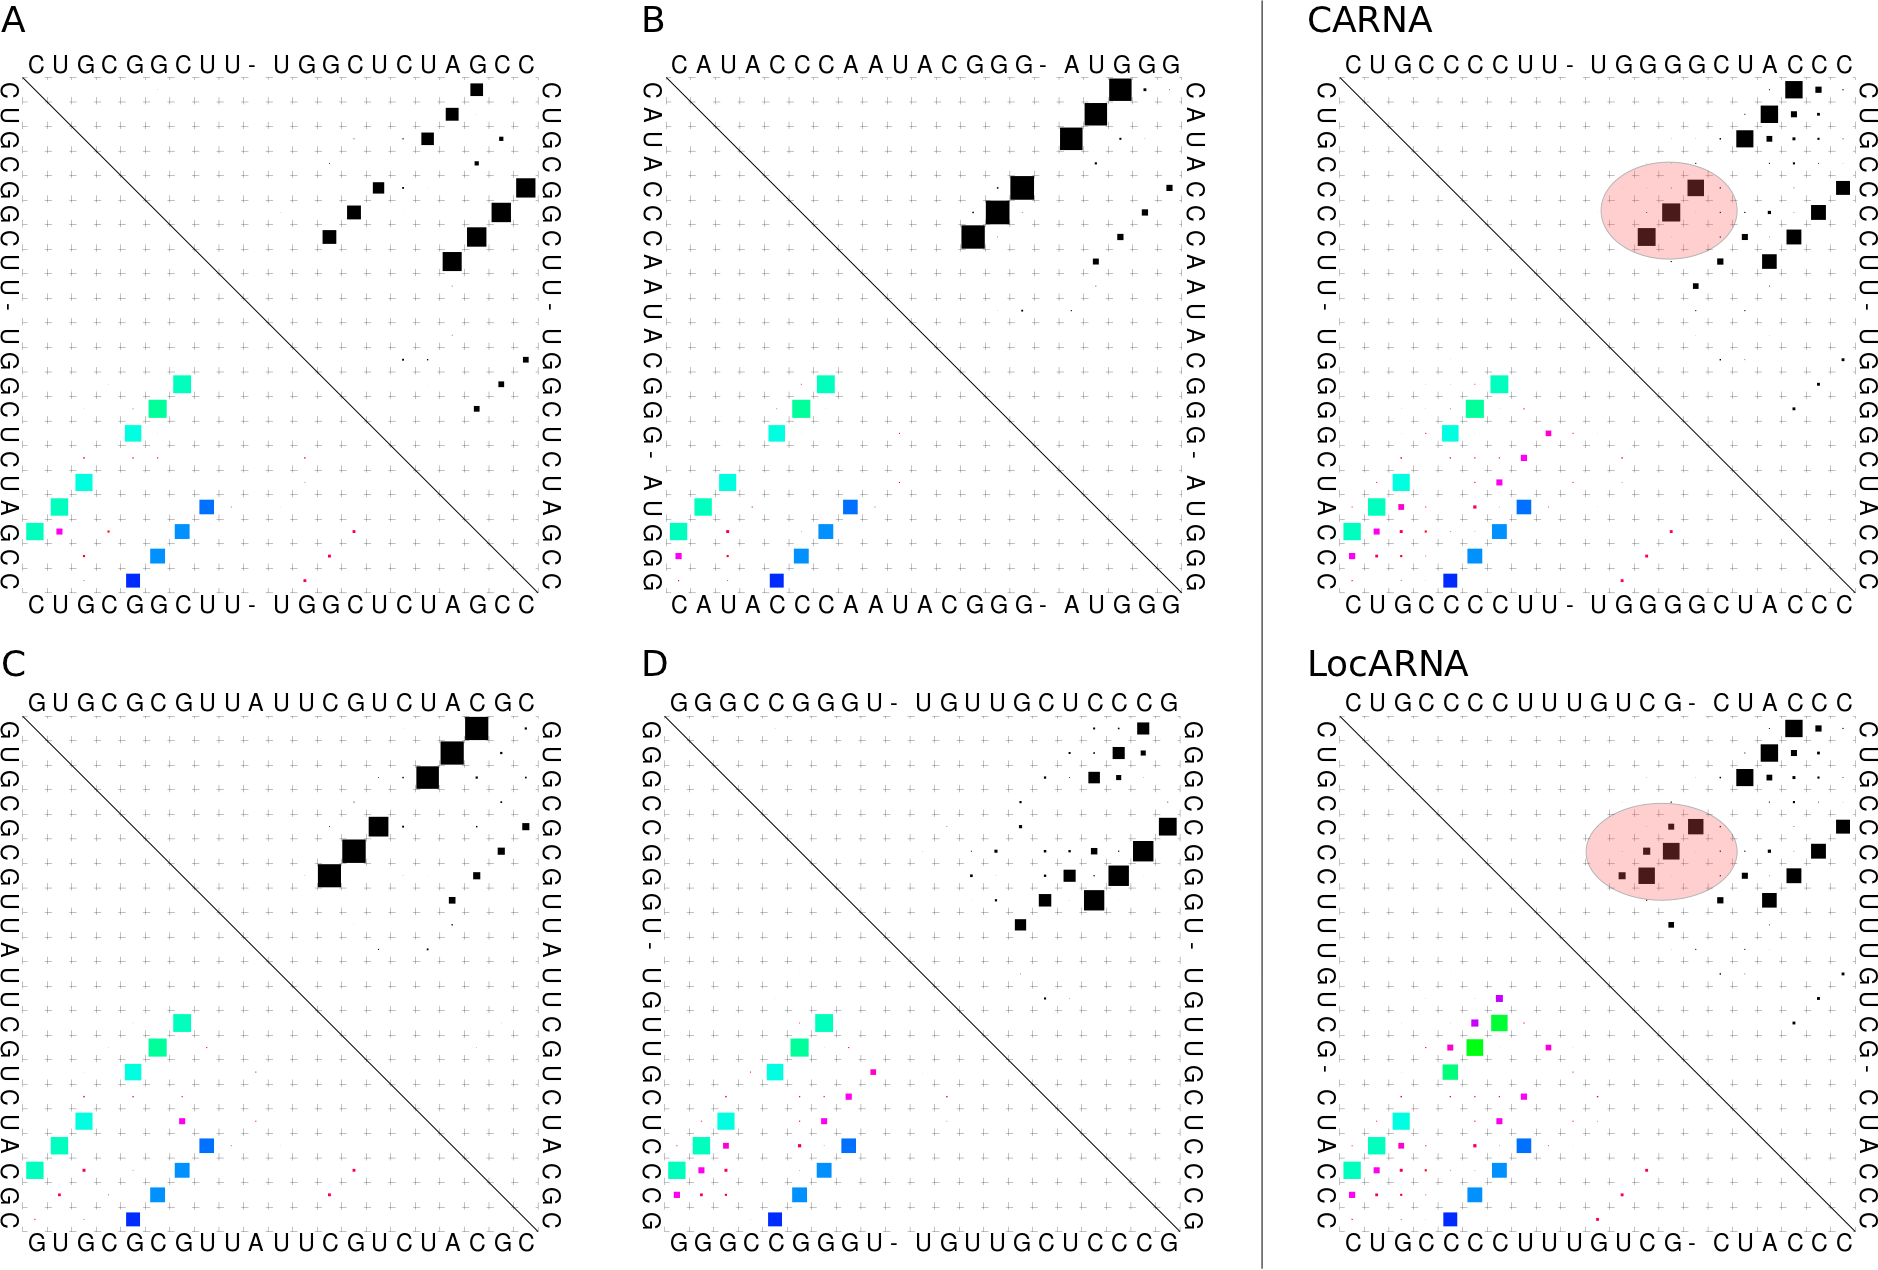 Conservation dot plots for xbix variants A-D, the consensus conservation
dot plot of CARNA's alignment and the consensus conservation dot plot of
the alignment by LocARNA. The LocARNA consensus dot plot shows a
misalignment of the inner stem of one of the two conserved structures.
Only CARNA can simultaneously align both structures and aligns this stem
and all other base pairs correctly. The misalignment by LocARNA is also
seen by annotating LocARNA's alignment with the two conserved structures:
Conservation dot plots for xbix variants A-D, the consensus conservation
dot plot of CARNA's alignment and the consensus conservation dot plot of
the alignment by LocARNA. The LocARNA consensus dot plot shows a
misalignment of the inner stem of one of the two conserved structures.
Only CARNA can simultaneously align both structures and aligns this stem
and all other base pairs correctly. The misalignment by LocARNA is also
seen by annotating LocARNA's alignment with the two conserved structures:
>xbixA
CUGCGGCUUUGGCU-CUAGCC
....((((......-..))))
(((.(((....)))-.)))..
>xbixC
GUGCGCGUUAUUCGUCUACGC
....((((.........))))
(((.(((.....))).)))..
>xbixD
GGGCCGGGUUGUUG-CUCCCG
....((((......-..))))
(((.(((....)))-.)))..
>xbixB
CAUACCCAAUACGGG-AUGGG
....((((.......-.))))
(((.(((.....)))-)))..
tRNA alignment
pseudoknot alignment
fixed pseudoknot structures
List of Changes
- 4.4.2 : consensus structure fixed; alignment output fixed; FASTA download without consensus structure
- 4.4.0 : CARNA v1.3.3 online
- 4.2.3 : linking Vienna RNA bugfix release 2.2.7
- 4.2.2 : CARNA v1.3.2 online : adaption to LocARNA v1.8.10
- 3.3.0 : CARNA v1.2.5 online : Bugfix for anchor constraint input
- 3.2.2 : CARNA v1.2.5 online : Bugfix for anchor constraint input
- 3.2.1 : Maximal sequence length in NUPACK (pseudoknot) mode lowered due to NUPACK failures for long sequences.
- 3.1.5 : CARNA v1.2.4 online + Bugfix for post-processing of small local alignments and for NUPACK pre-processing
- 3.1.2 : CARNA v1.2.3 online